“Change is the only constant” must have been a phrase first uttered by a marketer. The world of marketing is dynamic and ever-changing, and up-to-date audience data plays an imperative role in executing effective strategies to reach your target audiences. At Refuel, our data drives everything we do. Here are our most recent marketing statistics on COVID-19, teens, college students, multicultural audiences, and the military community.
COVID-19 Marketing Statistics
COVID-19 has irrevocably shaped our world, including consumer behavior and beliefs. We’ve curated these COVID-19 marketing statistics to help understand how consumer behavior, health habits, lifestyles, and beliefs have changed as a results of the pandemic.
- 62% believe our country will not make it through this crisis without brands playing a critical role in addressing the challenges we face. (Edelman’s 2020 COVID-19 Brand Trust Report)
- Three of four discuss COVID with their family while over two-thirds discuss with their friends. (Refuel Cause Explorer Series™)
- 59% of Americans have either contracted COVID-19 themselves or personally know someone who has. (Magenta)
- About a fifth (22%) of U.S. adults say they either changed their residence due to the pandemic or know someone who did. (Pew Research Center)
- Of the adults that moved, 68% say they relocated to a family member or friend’s home. (Pew Research Center)
- 43% of Americans share their opinions about COVID-19 on social media. (Refuel Cause Explorer Series™)
- 55% of American trust local TV news for their information about COVID-19. (Refuel Cause Explorer Series™)
- Only 29% of Americans trust social media for their information about COVID-19. (Refuel Cause Explorer Series™)
- 52% of Americans pay attention to healthcare experts when learning about COVID-19. (Refuel Cause Explorer Series™)
- 48% of Americans’ COVID-19-related actions are influenced by their friends and family. (Refuel Cause Explorer Series™)
- 57% of nonprofits say they’re operating with reduced resources compared to pre-COVID. 19% are operating with the same or more resources; 23% temporarily halted operations; 1% permanently halted operations. (VolunteerMatch’s 2020 The Impact of COVID-19 on Volunteering)
- One in five respondents feel that people are overreacting the coronavirus. (Refuel Cause Explorer Series™)
- The percentage of Americans engaged in multigenerational co-living has been increasing from a low point of 12% in 1980 to a record high point of 20% (64 million people) in 2016. (Pew Research Center)
- Adults over 25 are 23% more likely than Gen Z to believe that the coronavirus is a real issue. (Refuel Cause Explorer Series™)
- Two in five Americans are planning to get vaccinated as soon as it’s available. (Refuel Cause Explorer Series™)
- Over one-third of adults have taken a COVID-19 test in the last 12 months. (Refuel Cause Explorer Series™)
- Adults over 25 and parents are more likely to follow CDC guidelines, including wearing a mask and social distancing. (Refuel Cause Explorer Series™)
- 62% of Gen Z say they follow CDC guidelines, including wearing a mask and social distancing. (Refuel Cause Explorer Series™)
Cause Marketing Statistics
Cause marketing has become deeply rooted in today’s consumer behavior, as consumers are looking to brands to take a stand on the issues they believe in. We compiled these social impact marketing statistics from both our own proprietary research and others to understand what consumers believe in and expect from brands.
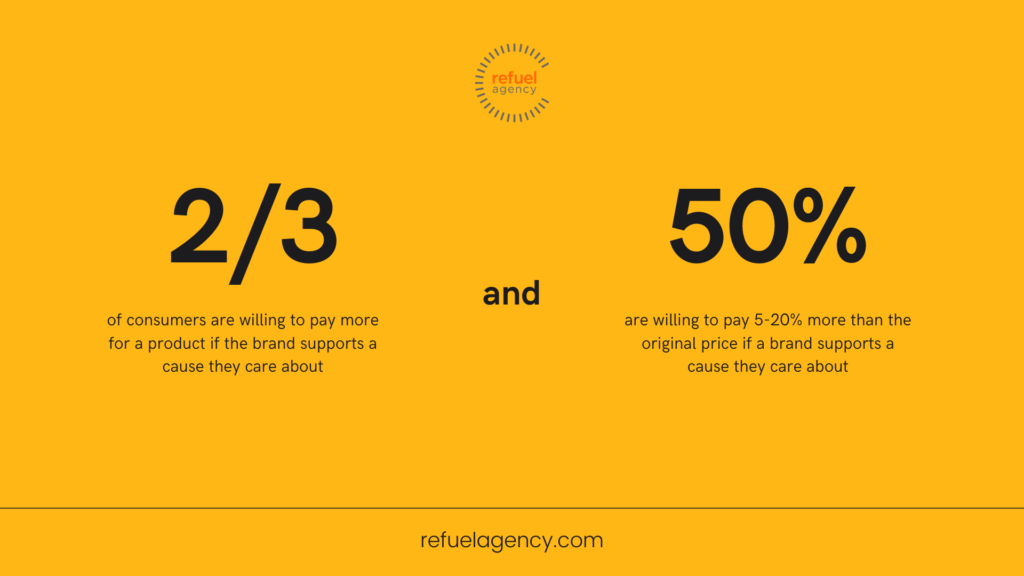
- Over two-thirds of consumers are willing to pay more for a product if the brand supports a cause they care about, and half are willing to pay 5-20% more than the original price. (Refuel Cause Explorer Series™)
- Over two-thirds (67%) are loyal to brands that support LGBTQ rights and racial equality (16% more than the general population). (Refuel Cause Explorer Series™)
- Three-quarters (76%) say a company’s marketing and advertising should be more reflective of the diverse and inclusive business they aspire to be, and more than half (54%) say if they don’t see themselves represented in a company’s marketing and communications, they are less likely to want to support that company. (Porter Novelli’s 2020 Addressing Social Justice & Diversity In Communications)
- A third of consumers donate money and 28% of consumers volunteer in their community. (Refuel Cause Explorer Series™)
- 44% of college students share their opinions on social media. (Refuel Cause Explorer Series™)
- 1 in 3 college students volunteer in the community. (Refuel Cause Explorer Series™)
- 34% of U.S. consumers stopped supporting a brand because it didn’t represent their identity (race, religion, sexual orientation, etc.) in its advertising. (Adobe)
- 34% of college students donate to non-profit organizations. (Refuel Cause Explorer Series™)
- 50% of Gen Z teens share their opinions on social media. (Refuel Cause Explorer Series™)
- 29% of Gen Z teens volunteer for the community. (Refuel Cause Explorer Series™)
- 1 in 4 Gen Z teens donate to non-profit organizations. (Refuel Cause Explorer Series™)
Hispanic Marketing Statistics
The Hispanic consumer audience is a rapidly growing and increasingly influential consumer segment in the US — with unique spending habits, media consumption behaviors, lifestyles, and worldviews. We compiled these Hispanic advertising statistics from our own research and others to understand how the Hispanic consumer thinks, what they believe, and how they behave.
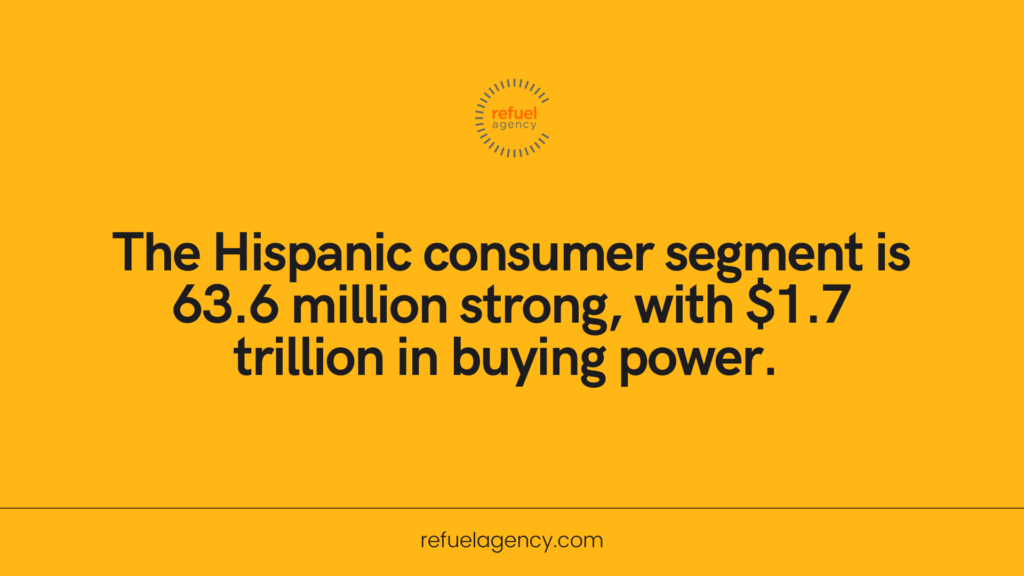
- The Hispanic consumer segment is 63.6 million strong, with $1.7 trillion in buying power. (Refuel Hispanic Explorer Series™)
- 26% of Hispanic consumers speak mostly English and some Spanish, while 24% speak mostly Spanish with some English. 28% speak only Spanish, and 16% speak only English. (Refuel Hispanic Explorer Series™)
- Almost half (49%) of Hispanics read any Spanish-language publication. (GfK MRI Doublebase)
- 26% are more likely to do so than non-Hispanics reading general market newspapers. (GfK MRI Doublebase)
- Spanish-language print readers are 57% more likely to be heavy readers (9+ issues per month). (GfK MRI Doublebase)
- Hispanics spend more than the national average on food, phone service, clothing/shoes. (Refuel Hispanic Explorer Series™)
- Quality and discounts are the two top motivators for Hispanic consumers to display brand loyalty. (Refuel Hispanic Explorer Series™)
- Visitors of Spanish language websites are 31% more likely to be heavy online users (25+ hours per week). (GfK MRI Doublebase)
- 4 out of 5 Hispanic consumers are social media users. (GfK MRI Doublebase)
- 3 out 5 Hispanic consumers are YouTube users (20% more likely than the general population). (GfK MRI Doublebase)
- 62% of Hispanics pay attention to online media (12% more than the general population). (GfK MRI Doublebase)
- 55% Hispanics pay attention to print media. (GfK MRI Doublebase)
- Newspaper ads are the #2 ad format that attract attention from Hispanic audiences (43%). (Refuel Hispanic Explorer Series™)
- Email (36%), social media (36%), and mobile ads (25%) are among the top 10 in grabbing attention. (Refuel Hispanic Explorer Series™)
- Hispanic audiences trust Spanish-language newspapers and websites more than non-Hispanic media. (Refuel Hispanic Explorer Series™)
African American Marketing Statistics
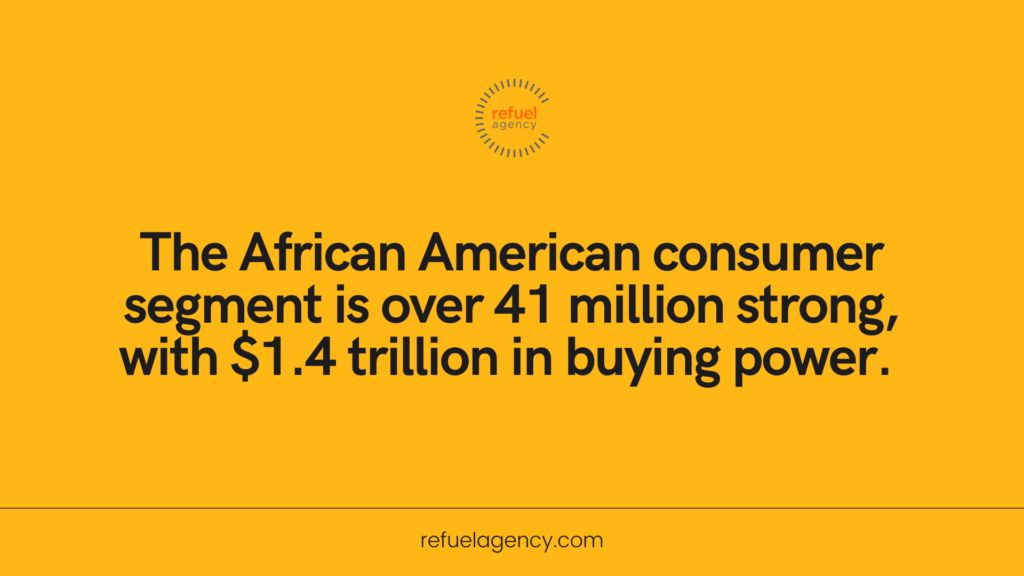
The African American consumer audience is a rapidly growing and increasingly influential consumer segment in the US — with unique spending habits, media consumption behaviors, lifestyles, and worldviews. We compiled these African American advertising statistics from our own research and others to understand how the African consumer thinks, what they believe, and how they behave.
- 54% of African Americans are under 34 years old. (Nielson)
- Black Americans are also among the youngest — 28% of African Americans are under 18, compared to 23% of all Americans. (Nielson)
- 72% read their local newspapers or magazines (19% more likely than the general population). (GfK MRI Doublebase)
- African Americans are more likely than the total population to agree that advertising provides meaningful information on most platforms, including mobile (42% higher), television (23% higher), radio (21% higher) and the Internet (18% higher). (Nielson)
- On average, they read approximately 15 issues per month. (GfK MRI Doublebase)
- They are 23% more likely to be heavy readers (9+ issues per month). (GfK MRI Doublebase)
- 83% are online users with an average usage of 30.1 hours per week (19% more than the national average). (GfK MRI Doublebase)
- They are 20% more likely to be heavy users (25+ hours per week). (GfK MRI Doublebase)
- 78% are social media users. (GfK MRI Doublebase)
- Over half (54%) are YouTube users (13% more likely than the general population). (GfK MRI Doublebase)
- Half are paying attention to print ads (14% more likely than the general population). (GfK MRI Doublebase)
- 57% pay attention to online ads (12% more likely than the general population). (GfK MRI Doublebase)
- African Americans are 19% more likely than the general population to trust online media. (GfK MRI Doublebase)
- African Americans are 17% more likely than the general population to join active duty service. (GfK MRI Doublebase)
- 48% of African Americans are working full-time, while 13% are working part-time and 38% are unemployed (GfK MRI Doublebase)
- 79% agree that “My cultural/ethnic heritage is an important part of who I am”. (GfK MRI Doublebase)
- 35% agree that “Achieving a higher social status” is very important to them. (GfK MRI Doublebase)
- 97% own smartphones (11% more likely than the general population). (GfK MRI Doublebase)
- 66% stream video content (14% more likely than the general population). (GfK MRI Doublebase)
- They are 28% more likely to click on an advertisement on social media. (GfK MRI Doublebase)
- 49% are likely to share their opinions about products and services by posting reviews and ratings online. (GfK MRI Doublebase)
- Total African American video game spending is $1.7 billion. (GfK MRI Doublebase)
Asian Marketing Statistics
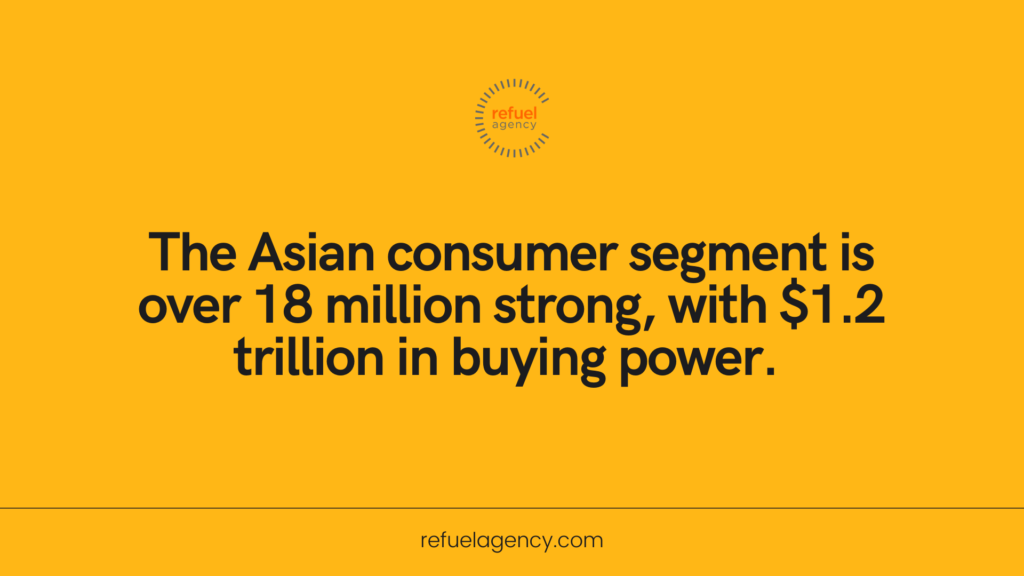
The Asian consumer audience is a rapidly growing and increasingly influential consumer segment in the US — with unique spending habits, media consumption behaviors, lifestyles, and worldviews. We compiled these Asian advertising statistics from our own research and others to understand how the Asian consumer thinks, what they believe, and how they behave.
- 62% of Asian consumers read their local newspapers or magazines. (GfK MRI Doublebase)
- 95% of Asian consumers are online users with an average usage of 30 hours per week (17% more than the national average). (GfK MRI Doublebase)
- They are 46% more likely to be heavy users (25+ hours per week). (GfK MRI Doublebase)
- 89% are social media users (11% more likely than the general population). (GfK MRI Doublebase)
- 87% constantly use email (16% more likely than the general population). (GfK MRI Doublebase)
- Two-thirds are YouTube users (56% more likely than the general population). (GfK MRI Doublebase)
- Two-thirds are music streaming services (6% more likely than the general population). (GfK MRI Doublebase)
- 42% are paying attention to print ads. (GfK MRI Doublebase)
- 60% pay attention to online ads (17% more likely than the general population). (GfK MRI Doublebase)
- Asians are 56% more likely than the general population to trust online media. (GfK MRI Doublebase)
Military Marketing Statistics
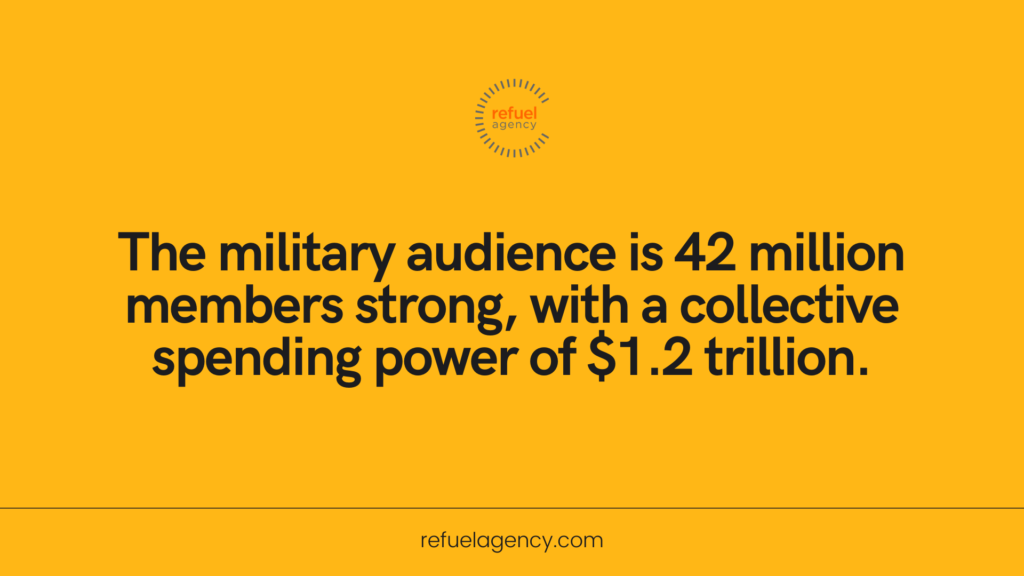
The military consumer audience is a rapidly growing and increasingly influential consumer segment in the US — with unique spending habits, media consumption behaviors, lifestyles, and worldviews. We compiled these military advertising statistics from our own research and others to understand how the military consumer thinks, what they believe, and how they behave.
- The military audience is 42 million members strong, with a collective spending power of $1.2 trillion. (Refuel Military Explorer Series™)
- Military families have an average of 2 children per household. (Refuel Military Explorer Series™)
- 40% of military personnel are Republicans, 9% are Democrats, and 45% are independent or have no party.
- Military members focus on online spending due to relocation and mobility. (SheerID)
- The military audience is more diverse than ever — there has been a 16% increase in multicultural active duty members since 2010. (Refuel Military Explorer Series™)
- Military members are 33% more likely to have an advanced degree than the general population. (Refuel Military Explorer Series™)
- Military spouses are 19% more likely to be employed full-time than the general population. (Refuel Military Explorer Series™)
- Two in every three members of the military said belonging to the military creates an immediate bond to others associated with the military. (SheerID)
- Post 9/11 veterans are 40% more likely to buy their clothing online than the general population. (Refuel Military Explorer Series™)
- Active duty are 2.3x more likely to be looking to buy a smart home device than the general population. (Refuel Military Explorer Series™)
- 85% declared that they identify with being a part of the military community, almost as strongly as they do with their family role (88%). (SheerID)
- Military spouses are 13% more likely to listen to standard radio than the general population. (Refuel Military Explorer Series™)
- Active duty military are 25% more likely to read military-related print magazines than the general population. (Refuel Military Explorer Series™)
- 250,000 military members, at an average age of 25, transition back to civilian life each year. (SheerID)
Youth Marketing Statistics
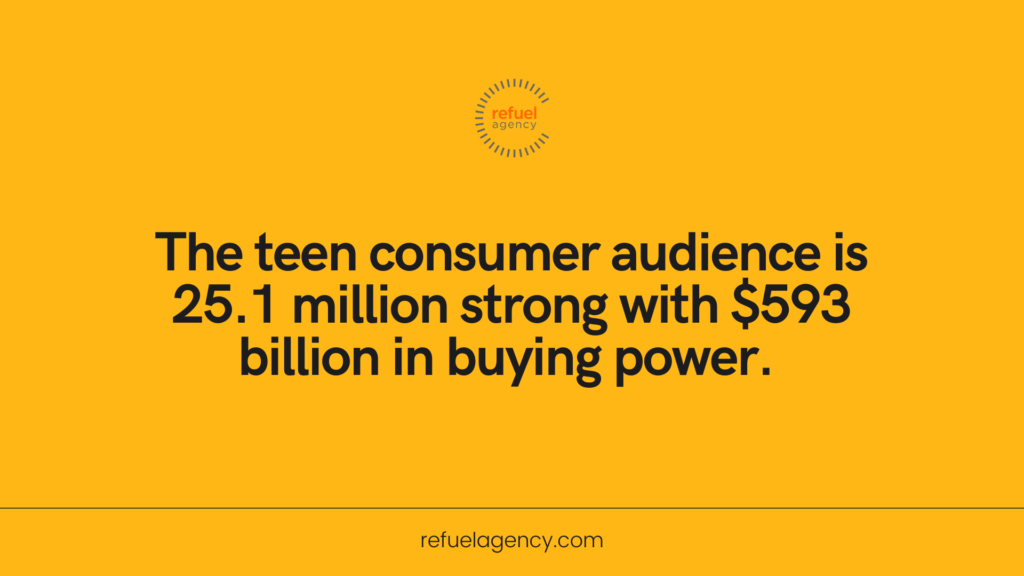
The teen and college consumer audience is an audience that is rapidly growing in buying power and influence. As digital natives, they have unique spending habits, media consumption behaviors, lifestyles, and worldviews. We compiled these youth marketing statistics from both our proprietary teen and college market research to understand how the teen and college consumers move through the world.
- The teen consumer audience is 25.1 million strong with $593 billion in buying power. (Refuel Gen Z Explorer Series™)
- The college consumer audience is 21 million strong with $3.9 trillion in buying power. (Refuel College Explorer Series™)
- 70% of TikTok users in the United States are ages 13-24 (Hootsuite)
- 59% of Gen Z visit brands’ website through their mobile device (37% more likely than the general population). (GfK MRI Doublebase)
- 1 in 3 Gen Z consumers share their opinions on social media. (Refuel Gen Z Explorer Series™)
- Two-thirds of Gen Z use their mobile device for social media consumption (35% more likely than the general population). (GfK MRI Doublebase)
- 80% of US teens 14-17 own smartphones and 90% of those teens watch videos on their devices. (Nielson)
- Gen Z are 80% more likely to engage with brands on social media. (GfK MRI Doublebase)
- 42% of Gen Z have purchased a product through their mobile device (28% more likely than the general population). (GfK MRI Doublebase)
- College students spend $13.1 billion on online/in-app food delivery. (Refuel College Explorer Series™)
- 84% use their mobile device for emails (19% more likely than the general population). (GfK MRI Doublebase)
- 2 in 3 teens still shop in brick and mortar stores. (Refuel Gen Z Explorer Series™)
- Quality (52%) and discounts (43%) were Gen Z’s top motivations to express loyalty to a brand. (Refuel Gen Z Explorer Series™)
Read next: The Ultimate Guide to Marketing to Gen Z
